
Most property owners, buyers, sellers and agents/brokers rely on automated pricing tools. Agents and brokers typically use a valuation tool within their MLS. Valuation tools utilize a range of different metrics. There is no set algorithm. As a result, they often provide very different pricing recommendations on the same property.
ALEX Labs Queries and Summarizes Best In Class. We query the tools that are considered best in class such as Zillow, Corelogic, HouseCanary. We summarize their market pricing, top of market and deal pricing recommendations for YOU.
ALEX Labs Proprietary Pricing Model. We use comparable sold values from MLS data specific to the subject property subdivision. Depending on the number of sales, our trend calculation may be based on prior quarter to date. ALEX Labs valuation is typically the most precise model since it is micro targeted at the subdivision level for comparable comparable sales. And ALEX Labs trending is typically the most precise as it trends values of each comparable sale to the expected close date of the subject property.
Sounds complicated. It is. But it's easy if YOU are an ALEX client, agent or broker. ALEX Labs and the Super Geeks do the work for YOU!
Check out ALEX's automated valuation tool below. Or click here, to go directly to the tool. Just enter any address and ALEX will give YOU an immediate valuation and email the estimated "deal" price and the "top of the market price." Then YOUR ALEX Agent will follow-up to determine if YOU want a Proprietary Pricing Model for a property.
Just ask ALEX.
The Valuation
ALEX Labs Proprietary Pricing Model. We use comparable sold values from MLS data specific to the subject property subdivision. Depending on the number of sales, our trend calculation may be based on prior quarter to date.
ALEX Labs valuation is typically the most precise model since it is micro targeted at the subdivision level for comparable comparable sales.
And ALEX Labs trending is typically the most precise as it trends values of each comparable sale to the expected close date of the subject property. This valuation is based on 3 comparables.
Each comparable value was trended from its closing date to the target property's ecpected closing.
This valuation is above the list price.
Valuation Sources
ALEX Labs Queries Best In Class Sources. We query the tools that are considered best in class such as Zillow, Corelogic, HouseCanary. We provide you our insight into their individual Market perspectives on the summarize their market pricing, top of market and deal pricing recommendations for you.
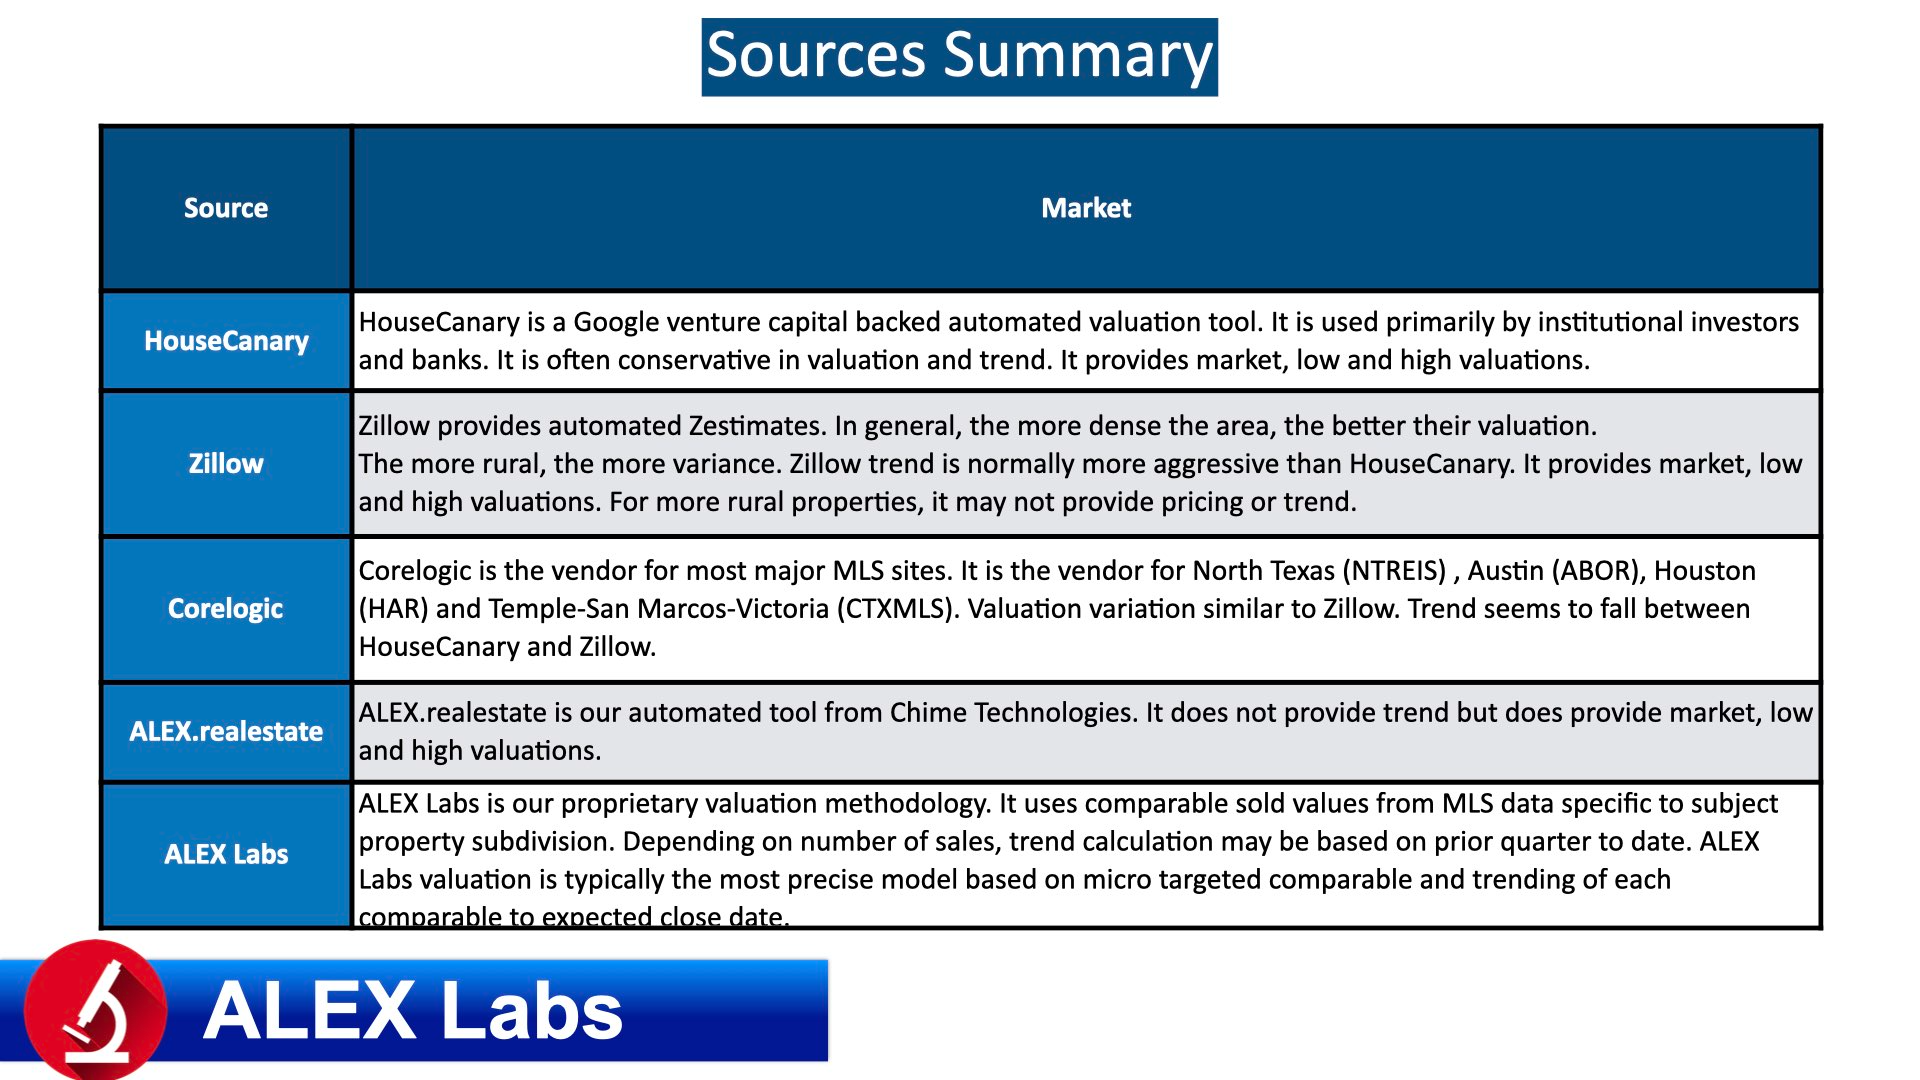
Analyze Each Valuation
ALEX Labs analyzes each valuation.
We report the market value from each source. If provided, we provide the low and high estimates from each.
And, published, we identify the trend they project.

Analyze What Else is For Sale
ALEX Labs analyzes each property on the market.
We report how many are for sale. The price range. How long they have been on the market? How big are the homes? What are the lot sizes? When the homes were built?
And, what is the list price per home SF?
With this information, YOU are a much more informed buyer or seller.

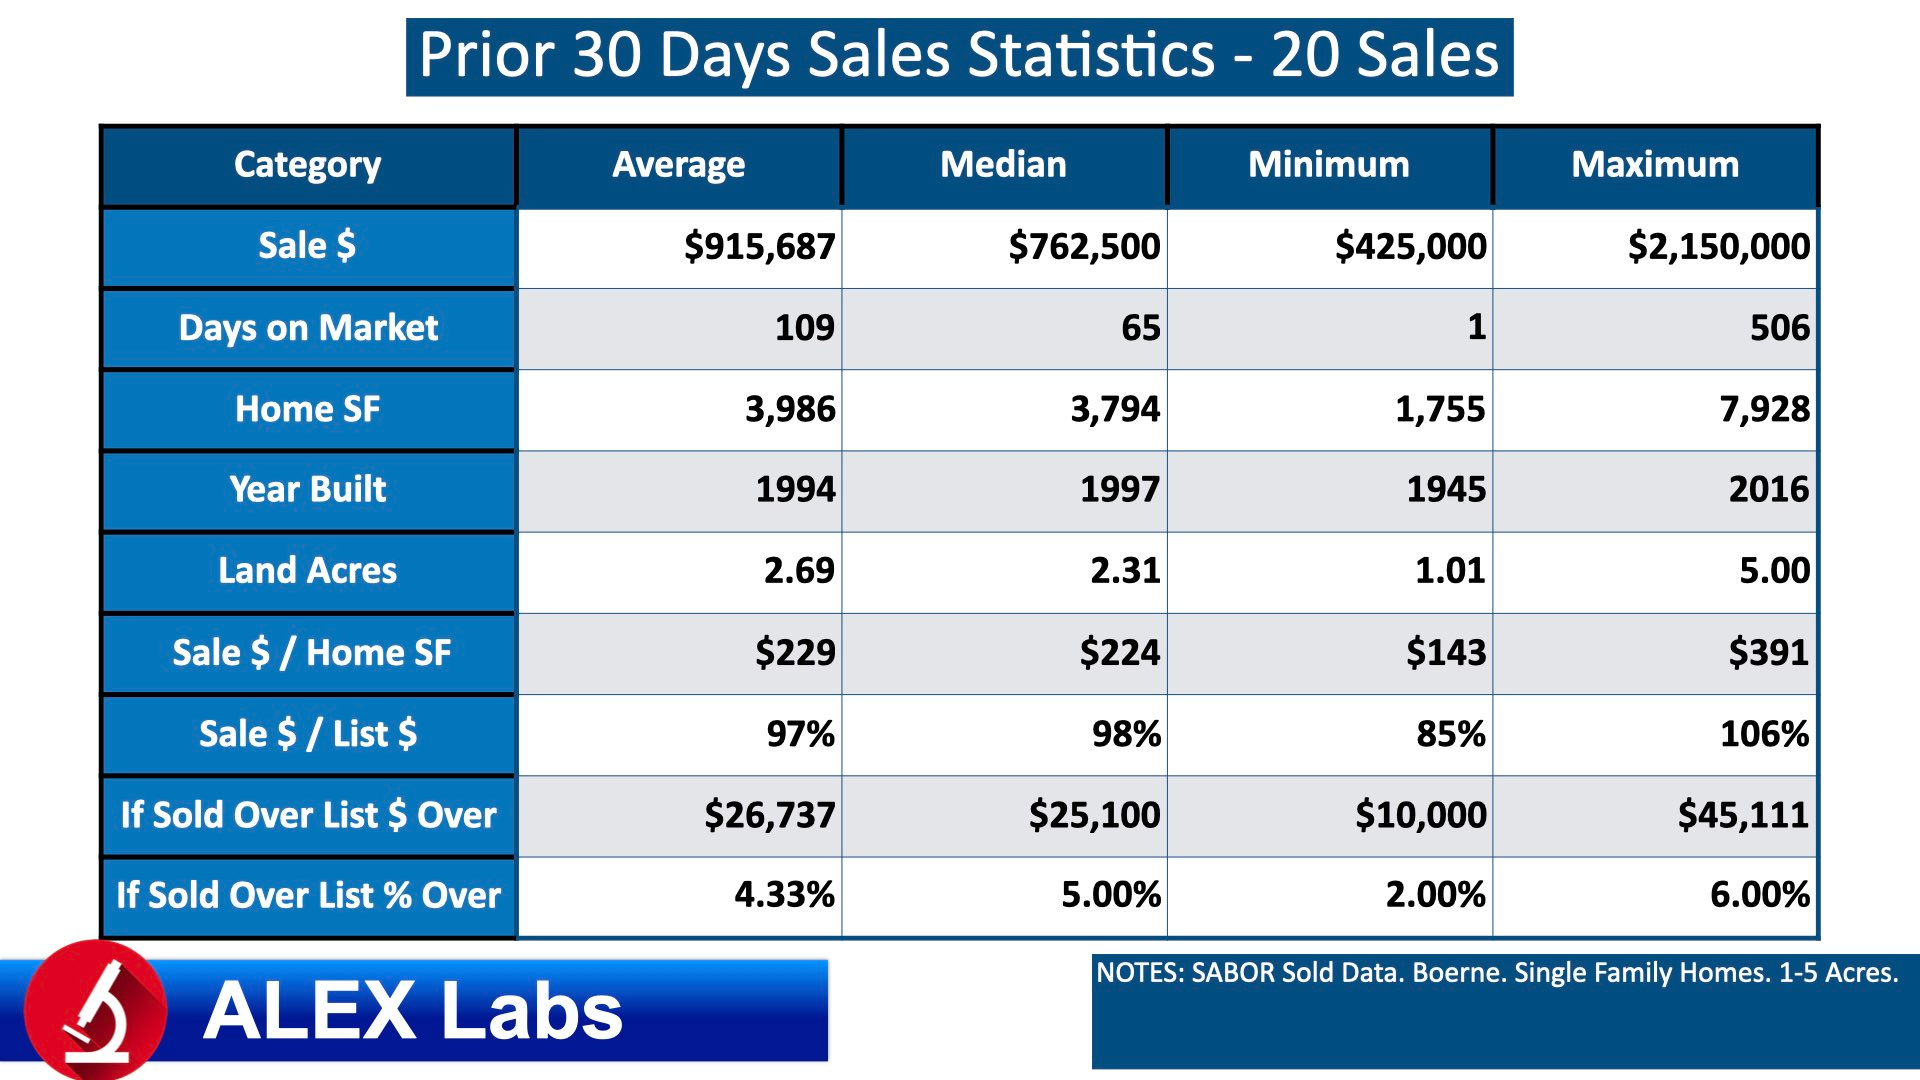
Analyze Prior Month Sales
ALEX Labs researches the prior month sales.
Traditional real estate statistics. We generate traditional real estate statistics. What was the average sale price? What was the average time a listing was on the market? What was the average sale price per SF? And other averages.
But, averages are only averages.
Median, Low and High Data Points. The median often tells YOU more than an average as it is not affected by the highest or lowest sales. We also report the low and the high sale prices. Are you buying at the low end of the market or at the top?
ALEX Market Competition Statistics. ALEX Statistic Super Geeks take a much deeper look at the data. They identify how many properties are selling over list, how much over list are they selling for, and what percent above list are they paying?
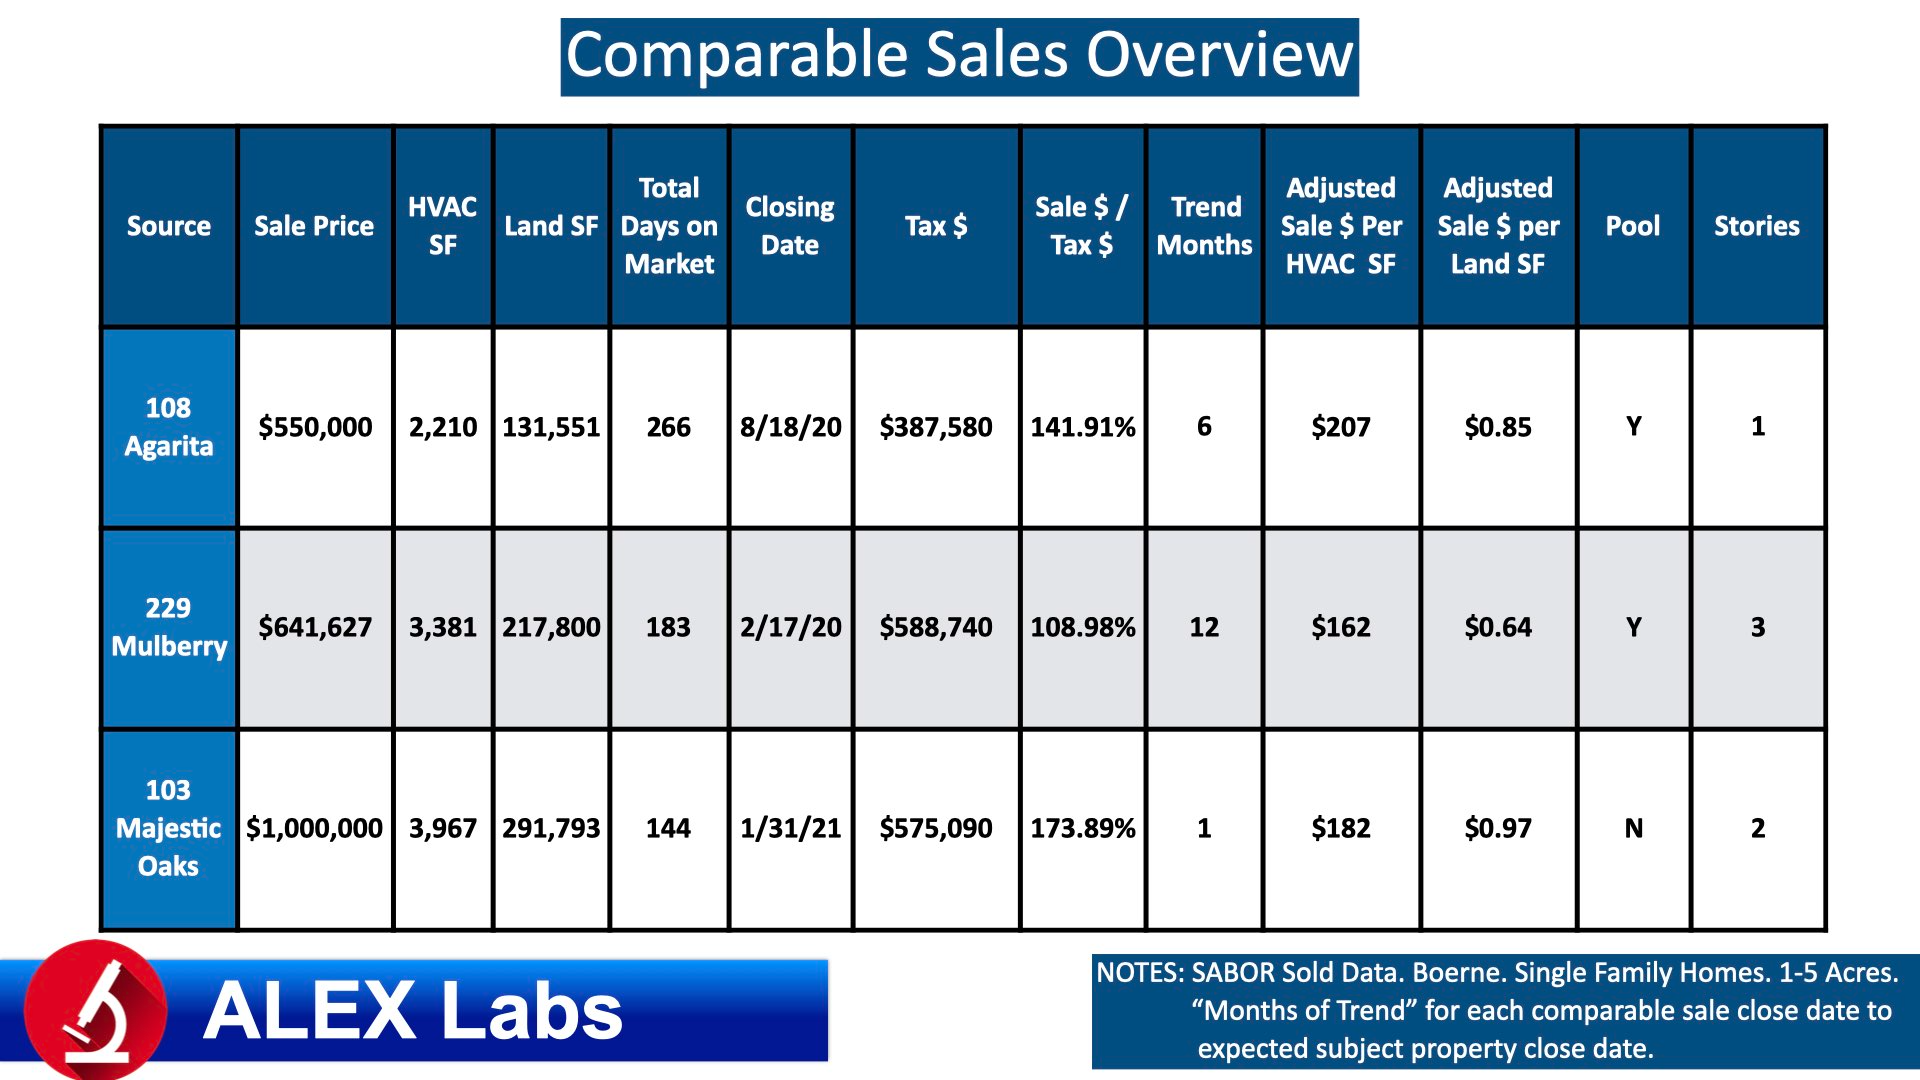
Comparable Sales & Adjusted Values
ALEX Labs researches the prior 1, 3 and 6 months of sales to find best comps.
Best Comparable Sales. "Best" is subjective. To minimize variables that require manual adjustment, ALEX Labs Sales Super Geeks search for properties in the same neighborhood or subdivision to find best matches.
Sales Statistics are Calculated. Sales Super Geeks define key statistics for each property.
Allocate Sales Price Between Improvements and Land. Using an ALEX Labs Proprietary Model, they allocate sale prices between land and improvments to determine "adjusted values per SF."
Unique Attributes. ALEX Sales Super Geeks identify unique attributes of the subject property as well as the comps to identify critical areas that may need further adjustment. In this example, having a "pool" and "number of stories" were identified as critical areas.
Trending Sales Values to Projected Closing Date. The next step is to trend each sale to the expected closing date. If trend is 12% a year, and a comparable property was sold 11 months ago, the sale price needs to be trended forwarded by 11% (11 months of 12% annual trend.)
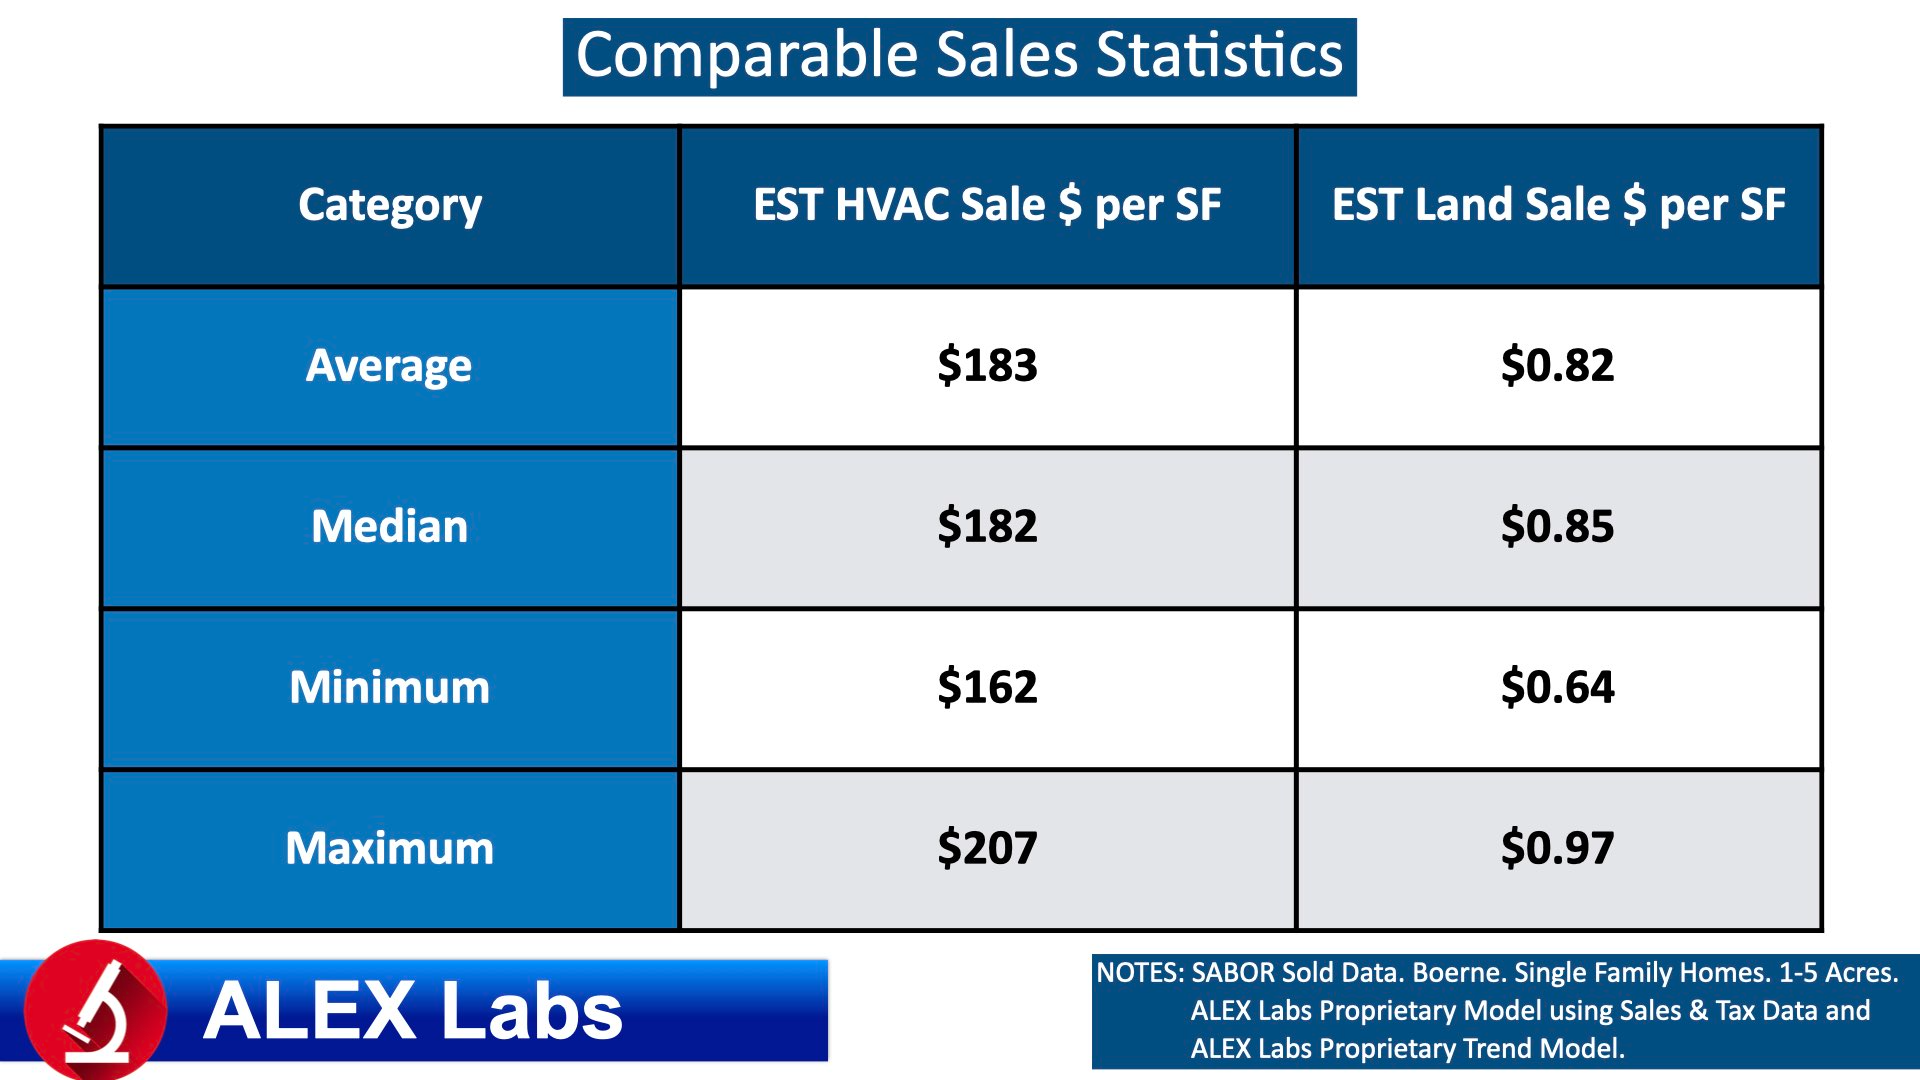
Comparable Sales Statistics
ALEX Labs Sales and Statistics Super Geeks gather together to finalize comparable sales statistics.
HVAC/Improvement Sales Statistics per SF. They finalize the average, median, low and high sale $ per SF for improvments.
Land Sales Statistics per SF. Then they finalize the average, median, low and high sale $ per SF for land.
But, they aren't done yet.
This tells them the history but what about the market competitiveness?
Sale $ per SF Trend
ALEX Labs Statistics Super Geeks take over here.
Reviewing Trend. They review monthly trend since January 2020 our time in the sand for Covid impact.
Selecting Months of Trend for Analysis. Depending on the number of sales and trend, they may recommend trend based on prior 3, 6, 9 or 12 months. In this example, they selected 3 months.
Why 3 Months and Not 12? Prior to 3 months, this particular micro market was not experiencing significant trend. If they used 12 months, it would underestimate the trend implication on the property.
Statistics per SF. Nothing wrong with averages, but they define the median and the maximum sales $ per SF for the trend.
This starts to paint a picture of the competitiveness of the property's micro market.
Sale $ Trend
ALEX Labs Statistics Super Geeks are still running the show.
Sale $ Statistics. Nothing wrong with averages, but they define the median and the maximum sales $ per SF for the trend.
Picture Outlines. This continues to paint a picture of the competitiveness of the property's micro market. This tells YOU how much similar properties are selling for and differences in the activity of each month of trend.
Days on Market Trend
ALEX Labs Statistics Super Geeks are still in the driver's seat.
Median Days on Market Statistics. Nothing wrong with averages, but they can really cause market misunderstandings in days on market. So, we normally report the median.
What are Cumulative Days on Market Anyways? Cumulative Days includes days if a property was listed before. For example, a property was listed for a year. The seller changed brokers. The property is listed again. The Days on the Market are 1 day, but the Cumulative Days on the Market are 366 (1 year prior listing + 1 day with this listing.)
This starts to fill out the competitive picture property's micro market.
Sale $ / List $
ALEX Labs Statistics Super Geeks are providing another ALEX Labs Market Disruptor with this analysis.
In some markets, realtors believe every property is selling above list. Well, in most cases that just isn't true.
Average and Median Sale $ / List $. Some people just like averages. No problem, ALEX Labs Super Geeks report them. And, they report the median.
Maximum Sale $ / List $. In this example, YOU can see that the Maximum $ over List is slowly increasing over time.
This competitive picture the property's micro market is becoming clear.
How Much Over List $
ALEX Labs Statistics Super Geeks are providing another ALEX Labs Market Disruptor with this analysis.
In some markets, realtors believe every property is selling well above list. Well, in most cases that just isn't true.
Trend in Sale $ Over List. In this example, you can see the median sale $ over list is increasing over time.
How Much Over List? And you can see how much over the sale price a successful offer looks like.
This competitive picture is about complete.
What % Over List $
ALEX Labs Statistics Super Geeks are providing another ALEX Labs Market Disruptor with this analysis.
In some markets, realtors believe every property is selling well above list. Well, in most cases that just isn't true.
Trend in Sale % Over List. In this example, you can see the median sale $ over list is increasing over time.
What % Over List? And you can see how what % over the sale price a successful offer looks like.
This competitive picture is pretty clear.