Best in Texas™ in Austin: Northwest Georgetown Statistics and Trends. Top 10 Findings. Dec 2020 to Dec 2022. ALEX Labs. ALEX Georgetown
ALEX Labs just released the Northwest Georgetown 78633 Zip Code. December 2022 Statistics Report. This Report analyzes single family residential sales from Dec 2020 to Dec 2022 and presents key monthly data and trends in easy to understand charts and summary tables.
NOTE: Sun City is excluded from this analysis and will be separately reported.
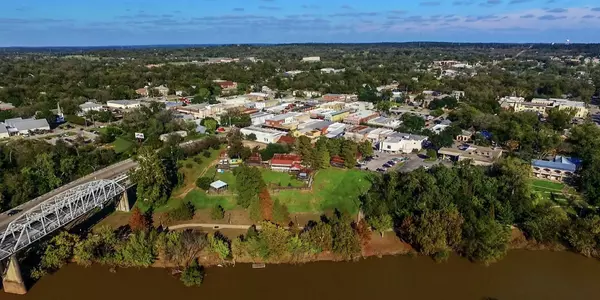
Northwest Georgetown is 36 miles north of Downtown Austin.
UPDATED MODEL
Thanks for feedback. ALEX Labs has added many new tools and charts.
Property Attributes: This is the most requested new tool. We are providing analysis of pool homes, new homes, resales, views (lake front, golf, other view, etc.), age of home, single story, multi-story, etc.
Net Sale $: We adjust the reported Sale $ by any repairs paid by Seller or Buyer Closing Costs paid by Seller. This provides a more accurate valuation. All Sold $ and Sold $ per SF valuations are based on Net Sale $.
Key Findings: For each blog we will focus on key findings.
Complete Report Available: Call, text or email Diane to request a complete report.
Want Your Farming Area Added? Talk with Diane!
ATTRIBUTE SUMMARY TABLE

MEDIAN STATISTICS SUMMARY TABLE

10 KEY FINDINGS
#1 Pool homes sold for 37% more per SF
Dec 2022 sold $ per SF for homes with a pool was $267 compared to $195 per SF for homes without a pool. This indicates a $72 per SF or 37% difference.

Limitation: In general pool homes are at the upper end of markets so the $ difference for a pool is exaggerated. In a recent analysis of The Woods in northwest Georgetown, the value of a pool was estimated at $137,000.
#2 One story homes sold for 25%+ more per SF

In Dec 2022 single story homes sold for $234 per SF compared to $185 per SF for multi story homes. This indicates a $49 per SF or 26% difference.
#3 Number of sales and total sales volume increased 13% in Dec 2022 from Nov 2022

27 sales in Dec 2022 up 13% from sales Nov 2022

Total Dec 2022 sales volume was $17.025M up 13% from Nov 2022
#4 Sale $ per SF was $211 down 10% from Nov 2022

#5 93% of sales were under list $

#6 Average days on market increased 33% or 0.52 days per day Dec 2022 compared to Nov 2022

64 (Dec 2022) / 48 (Nov 2022 / 31 (days in December) = 0.52 days
#7 Average List $ per SF decreased 12% or $1.03 per day Dec 2022 compared to Nov 2022

$267.91 (Nov 2022) – $235.92 (Dec 2022) / 31 (days in December) = $1.03 dollars
#8 Average discount from list was 4.2% or $12,757
#9 Homes on view lots sold for 6% or 12$ per SF more
In Dec 2022 the sold $ per SF for homes with a view was $224 compared to $211 per SF for homes without a view. This indicates a $12 per SF or 6% difference.
#10 Average sale $ per home increased but driven by larger homes
$630,561 (Dec 2022) – $610,246 (Nov 2022) = $20,314 higher average sale price.
2,732 SF (Dec 2022) compared to 2,319 SF (Nov 2022).
$226.68 sale $ per SF (Dec 2022) compared to $252.02 sale $ per SF (Nov 2022).
SEARCH NORTHWEST GEORGETOWN REAL ESTATE & HOMES FOR SALE
FOR MORE INFORMATION
Diane Hart Alexander, MBA, MHA, Broker CEO
Alexander Tiffany Southwest dba ALEX.realestate
Chairman, ALEX Cares
v 713.591.9902
o 713.918.9951
e diane@alex.realestate
Categories
- All Blogs (801)
- Abilene TX (3)
- AI (4)
- AI in Cancer Treatment (1)
- AI in Healthcare (1)
- Allen TX (2)
- Altos Research (1)
- Amarillo TX (4)
- Arlington TX (15)
- Atascocita TX (2)
- Atascosa County TX (1)
- Austin (264)
- Austin TX (4)
- Baby Boomers (1)
- Bandera County TX (1)
- Bandera TX (1)
- Bastrop County TX (25)
- Bastrop TX (3)
- Bee Cave TX (8)
- Bell County TX (21)
- Best Cities to Buy a Home Under $300K (2)
- Best Deals in East Austin (1)
- Best Deals in Greater Austin (1)
- Best Deals in Greater Dallas (1)
- Best Deals in Greater Dallas Under $500K (1)
- Best Deals in Greater San Antonio (1)
- Best Deals in San Antonio Under $500K (2)
- Best Deals in Sun City TX (2)
- Best Deals of the Week in Bastrop (1)
- Best Deals of the Week in Fredericksburg (1)
- Best Deals of the Week in Leander (1)
- Best Deals of the Week in Liberty Hill (1)
- Best Deals of the Week in San Antonio (1)
- Best Deals of the Week in South Aaustin (1)
- Best Deals Under $500K (1)
- Best in Texas Best Time to Sell a Home (1)
- Best In Texas Cities to Start a Business (5)
- Best in Texas Colleges & Universities (5)
- Best in Texas Elementary Schools (4)
- Best in Texas Fastest Growing Suburbs (4)
- Best In Texas Job Markets (3)
- Best in Texas Most Affordable Suburbs (4)
- Best In Texas Most Livable Small Cities (3)
- Best in Texas Most Popular Neighborhoods (5)
- Best In Texas New Construction (1)
- Best in Texas Places to Retire (1)
- Best in Texas Small Towns (1)
- Best in Texas Wealthiest Cities (5)
- Best States For (3)
- Bexar County TX (7)
- Blanco TX (1)
- Boerne TX (4)
- Bonham TX (1)
- Brownsville TX (2)
- Bryan TX (1)
- Buda TX (11)
- Burnet County TX (18)
- Burnet TX (2)
- Caldwell County TX (20)
- Cameron TX (1)
- Canton TX (1)
- Carrollton TX (2)
- Cedar Park TX (20)
- Central Austin (2)
- College Station TX (1)
- Collin County TX (1)
- Comal County (1)
- Comal County TX (1)
- Comfort TX (1)
- Conroe TX (1)
- Corpus Christi TX (4)
- Corsicana TX (1)
- Dallas County TX (6)
- Dallas TX (29)
- Deal of the Week (1)
- Deep 6 AI (1)
- Dell (1)
- Denton County TX (1)
- Denton TX (3)
- Denver CO (10)
- Dripping Springs TX (12)
- East Austin TX (3)
- East Georgetown TX (16)
- East Round Rock TX (3)
- Edinburg TX (1)
- El Paso TX (13)
- Elgin TX (9)
- Ellis County TX (1)
- Elon Musk Memphis (1)
- Fannin County TX (1)
- Far West Austin TX (2)
- Fastest Growing Cities in Texas (1)
- Fintech (1)
- Floresville TX (1)
- Flower Mound (1)
- Flower Mound TX (1)
- Forney TX (1)
- Fort Bend County TX (8)
- Fort Worth TX (19)
- Fredericksburg TX (13)
- Frio County TX (1)
- Frisco TX (4)
- Galveston County TX (5)
- Garland TX (3)
- Georgetown TX (48)
- Grand Prairie TX (2)
- Grayson County TX (1)
- Greater Austin (4)
- Greenest Cities in Texas (1)
- Guadalupe County TX (1)
- Harvard Business School (1)
- Hays County TX (25)
- Health Science Centers (1)
- Hondo TX (1)
- Houston TX (36)
- Hutto TX (11)
- Irving TX (13)
- Jarrell TX (6)
- Kaufman County TX (1)
- Kendall County TX (1)
- Killeen TX (2)
- Kyle TX (17)
- Lago Vista TX (8)
- Lakeway TX (15)
- Laredo, TX (1)
- Laredol TX (1)
- LBJ (1)
- League City TX (1)
- Leander TX (23)
- Lewisville TX (2)
- Liberty Hill TX (16)
- Lockhart TX (10)
- Longview TX (1)
- Lubbock TX (14)
- Manor TX (1)
- Mansfield TX (1)
- Marble Falls TX (1)
- McAllen TX (3)
- McKinney TX (5)
- MD Anderson (1)
- Medina County TX (1)
- Memphis TN (1)
- Mesquite TX (2)
- Midland TX (2)
- Milam County (1)
- Mission TX (1)
- Montgomery County TX (6)
- Most Fun Cities in Texas (2)
- Navarro County TX (1)
- New Braunfels TX (6)
- North Austin TX (1)
- North Round Rock (1)
- Northwest Georgetown TX (12)
- Nvidia (1)
- Odessa TX (2)
- Oklahoma City OK (6)
- Pasadena TX (1)
- Pearland TX (1)
- Pearsall TX (1)
- Pflugerville TX (13)
- Plano TX (15)
- Pleasanton TX (1)
- Raleigh NC (6)
- Real Estate Trend (1)
- Richardson TX (2)
- Rockwall County TX (1)
- Rockwall TX (1)
- Round Rock TX (27)
- Rowlett TX (1)
- Salt Lake City UT (6)
- San Antonio TX (40)
- San Marcos TX (18)
- Seguin TX (1)
- Sherman TX (2)
- Small Business (1)
- SmartAsset (3)
- South Austin TX (2)
- Spicewood TX (12)
- Stonewall TX (1)
- Sugar Land TX (1)
- Sun City TX (19)
- Taylor TX (10)
- Temple TX (2)
- Texas Commercial Real Estate (1)
- Texas Innovation & Technology (1)
- Texas Tech (1)
- Texas Tech Health Sciences Center (1)
- The Hills TX (6)
- The Woodlands TX (2)
- Toyota Texas (1)
- Travis County TX (22)
- Tyler TX (2)
- Victoria TX (1)
- Waco TX (1)
- Waxahachie TX (1)
- West Georgetown TX (12)
- West Round Rock TX (1)
- Wichita Falls TX (1)
- Williamson County TX (35)
- Wilson County TX (1)
- Wimberley TX (9)
- Xai (1)
- Zan Zandt County TX (1)
Recent Posts